General Storm Evolution | Daily Highlights | Snowfall Total Maps | Satellite Imagery
Wednesday | Thursday | Friday |
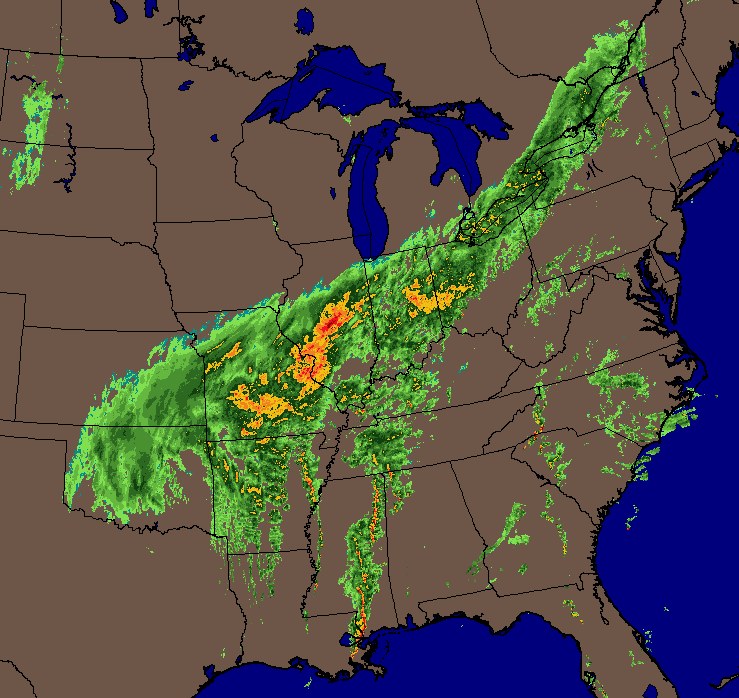
Eastern United States Composite Radar |
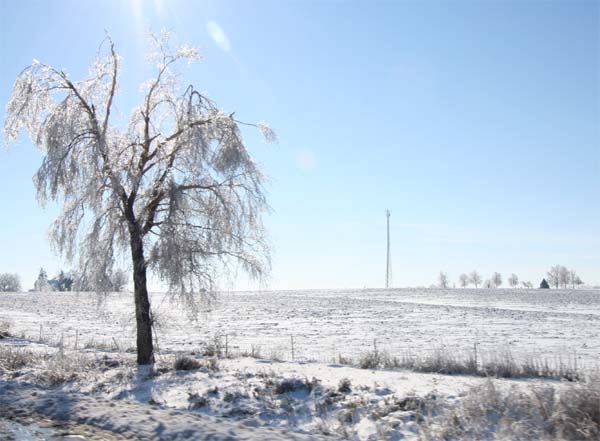
Central Illinois Heavy Ice Accumulation |
Chase Target: Peoria, Illinois
Arrival Date: November 30th at 2:30 a.m.
Driving Time: 5 1/2 Hours
Chase Rating
Forecast Surface Map |
We left for Peoria between 8 and 9 p.m. on Wednesday Night. It would be a
5-6 hour drive ahead of us. It was dark and rain was expected north of Mt
Vernon. I wondered if it might not take longer because of worsening
conditions further north. Ice was already being reported across the river
in Missouri. Temperatures were also starting to fall in the Illinois
Counties bordering Missouri. A strong cold front was positioned just to
the west and northwest of the KPAH Region. At 8 p.m. the front was
entering Western and Central Illinois and then extended into Central Missouri.
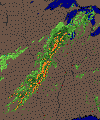
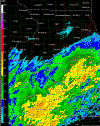
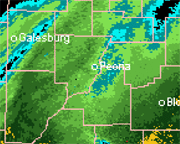
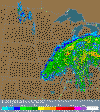
Another aspect of this storm system was the heavy rain/thunderstorms (see images
below) across a large portion of Oklahoma, Missouri, and Illinois.
Rainfall totals exceeded 3 inches in some locations. Flash flood warnings
were issued for a number of counties because of rapid runoff. Thankfully
we only had to drive through 30 minutes of heavy rain and that was near Mattoon,
Illinois. Thunderstorms were observed in Mattoon around 1 a.m. There
were four flashes of lightning to the northeast of the city. The front hit
us around that time. Winds gusted to around 30 mph as the front passed.
Temperatures were already beginning to fall while the thunderstorm was
occurring. Temperatures fell rapidly behind the arctic cold front. From
Mattoon, Illinois to Peoria (approximately 100 miles) the temperature fell
approximately 30-35 degrees. Temperatures fell 15 degrees within just a
few minutes of frontal passage (see temperature gradient map below).
Wednesday Evening Temperature Map. |
7:30 p.m. Weather Radar |
Wednesday Evening Lightning Data. |
Wednesday Evening IR3 Satellite |
6 p.m. Temperature Map for Missouri and Illinois |
6 p.m. Surface Pressure Map |
6 p.m. 3 Hour Pressure |
6:15 Central Illinois Radar |
Peoria Radar Animation |
Peoria Radar - 8:20 p.m. Thursday Evening. |
Peoria Radar - 9 p.m. Radar Thursday Evening |
9:15 p.m. Bright Banding |
RUC Evening Surface Forecast Map |
10:15 Central Illinois Radar |
G.R. Storm Reports Map for Missouri and Illinois |
12 a.m. 500mb Map |
7 a.m. 500mb Map |
Noon 500mb Map |
6 p.m. 500mb Map |
1 a.m. 850 - 500mb -ub/s mrhum and Thickness |
1 a.m. 850mb Temperature |
3 a.m. National Radar |
4:30 a.m. Thundersleet and |
Friday Morning |
5 a.m. Surface Map |
700mb Map showing the Dry Slot and Trowel |
6 a.m. 850-500mb -ub/s RH and Thickness Chart. |
7 a.m. SPC Surface Map |
7 a.m. SPC 850mb Map |
7 a.m. SPC 700mb Map |
7 a.m. SPC 500mb Map |
4 Panel Midwest Winter Map |
7 a.m. 700mb VV Chart |
3 Hour Pressure Falls on Friday Morning. |
24 Hour National Radar |
7 a.m. Central IL Radar. Banding over Peoria. |
7 a.m. Heavy snow falling in Peoria. |
8 a.m. Power Outage |
Storm Pulling Away |
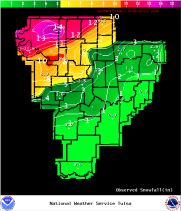
Snowfall and Ice Map |
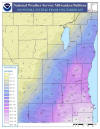
Snowfall Totals |
Milwaukee, NWS |
KILX 3 Day Precip |
Ohio Valley Enhanced |
Color Enhanced |
Large Northern Hemisphere |
Enhanced Water Vapor Image |
Central U.S. Zoomed |
Illinois Water Vapor |
Ohio Valley Water Vapor
|
Eastern U.S. Enhanced |
Michigan Water Vapor |
Northeast U.S. Thunderstorms |
Eastern U.S. Morning Visible |
NOAA Goes 12 Enhanced |
Modis Image |
Visible Image |
Milwaukee NWS |
Ohio Valley Image |
Visible Image of Snowfall |
Wichita, Kansas, NWS |
Springfield, MO - NWS |
Tulsa, OK - NWS |
Page design inspired by cimss.ssec.wisc.edu